Embedding book highlights onto a vector space
Inspired by this post, I chose to create my own solution to automatically export my book highlights on a website and map them onto a vector space in order to have features such as semantic search.
The process is all serverless, free, and automated. As a bonus, I also get 3 highlights sent to my inbox every day. And again, my total cost for this whole infrastructure is $0.
Here’s the final result: books.alessandroferrari.live
And a live representation of my highlights:
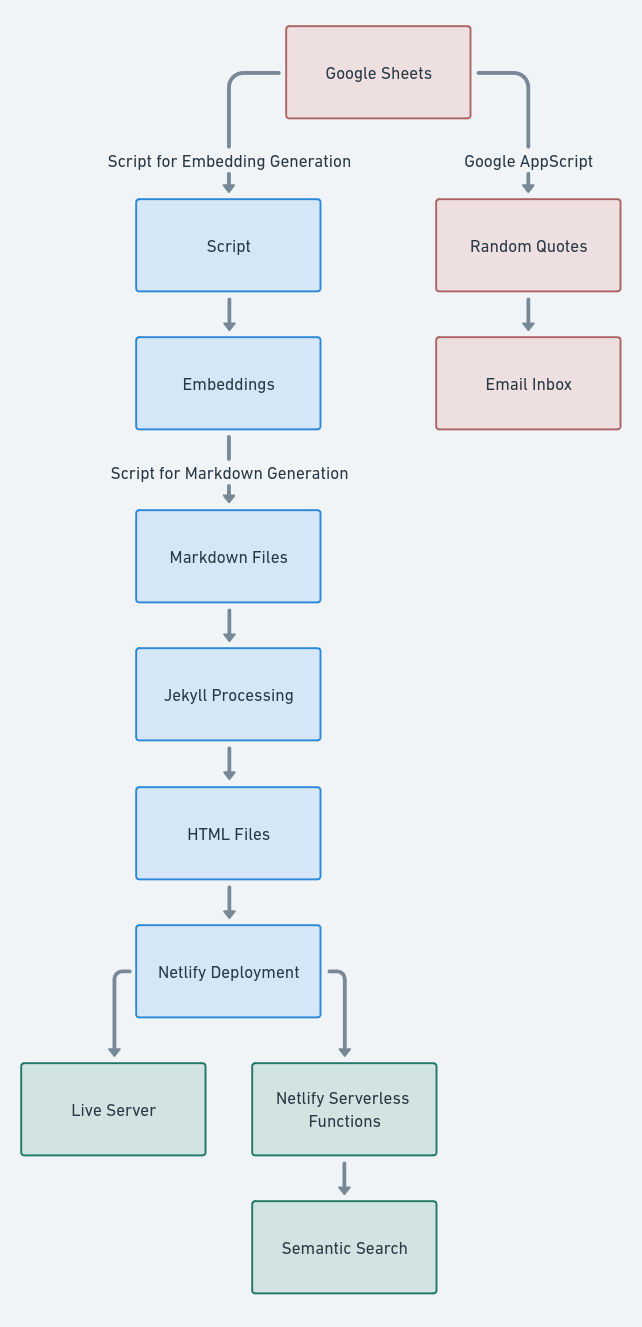
The whole system is structured in such a way that every time the google sheet gets updated, the website reflects it after just a few minutes. The system is open an expandable, and features such as emailing yourself your own quotes can be implemented trivially.
Exporting book highlights onto a website
There are plenty of resources that explain how to automatically export highlights taken on platforms such as kindle or iBook as a csv format, so I won’t cover that step of the process. It only takes 5 minutes per book to do it manually anyways, and the process varies drastically depending on which reading app you use, for this reason I haven’t included any book exporting pipeline in my system.
The important part is: all your highlights should be held in a google sheet formatted like this:
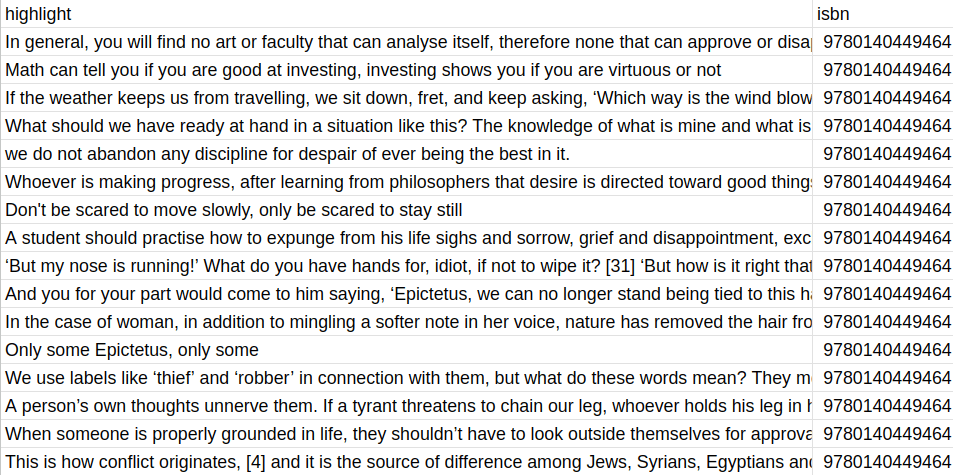
All I keep is the actual highlight and the isbn. Anything else is just useless data to move around. I have been thinking about keeping highlight notes in this csv as well, however I like the idea of the website being pure quotes, with my own thoughts on those quotes being stored somewhere else.
The next step is to somehow put these quotes onto a website. Going from this google sheet to a published website is a 4 step process:
Steps
- Getting the data as a csv file
- Break up and format the data in a way that is understandable by jekyll
- Generate embeddings from this data
- Deploy the generated site on a hosting service
Getting the Data
I found out recently that you can just curl google sheets documents as csv files with this command:
curl -L <google sheet url> -o sheet.csv
This completes part 1. The only caveat is that the google sheets needs to be readable by anyone with the link, which isn’t something that I particularly care about as everything on that sheet will already be published onto the website.
Formatting the data
Since I already use Jekyll for the main section of my website I chose to use jekyll for this section too. It’s simple and I’m somewhat familiar with it, however this same process could be replicated with any SSG (or even a webdev framework).
I have a simple python script that generates the jekyll pages based on the url of the spreadsheet. It also adds the authors, titles, cover images, and publishing dates based on google books API. You can find the script here.
For the script to work, make sure that you google books API key is in the environment variable GOOGLE_API_KEY.
The script will generate markdown files of this format:
---
layout: post
title: "The Sailor Who Fell from Grace with the Sea"
authors: "Yukio Mishima"
publisher: "Vintage"
publishedDate: "1994-05-31"
coverImage: "http://books.google.com/books/content?id=B-eBAAAAIAAJ&printsec=frontcover&img=1&zoom=1&source=gbs_api"
highlights:
  - "While Noboru wandered through private dreams Tsukazaki stood at Fusako’s side, and the heat of his body in the sultry chart room was beginning to oppress her: when the parasol she had leaned against a desk clattered suddenly to the floor, she felt as if she herself, fainting, had fallen."
  - "He hadn’t been able to explain his ideas of glory and death, or the longing and the melancholy pent up in his chest, or the other dark passions choking in the ocean’s swell."
  - "He ..."
---
And this is the post layout that this script uses:
---
layout: default
---

<!DOCTYPE html>
<html>
<head>
    <title>Embedding book highlights onto a vector space</title>
    <script>
    function copyToClipboard(elementId, element) {
        var url = window.location.href.split('#')[0] + '#' + elementId;
        navigator.clipboard.writeText(url).then(function() {
            element.classList.add("clicked");

            setTimeout( function() {
                element.classList.remove("clicked");
            }, 100);
        }).catch(function(err) {
            console.error('Could not copy text: ', err);
        });
    }
    </script>
</head>
<body>
    <div style='text-align: center;'>
        <img src='' alt='Embedding book highlights onto a vector space' style='max-width: 80%;'>
    </div>

    <h2 style='text-align: center; font-weight: bold; font-size: 24px;'>Embedding book highlights onto a vector space</h2>
    <p style='text-align: center;'><br></p>

    <h3 style='text-align: center;'>Highlights</h3>
    <ul style="list-style-type: none; text-align: center; padding: 0;">

    </ul>

    <a href="/">Back to Home</a>
</body>
</html>
Already, this creates a perfectly functioning website in which all of your book highlights will be displayed. I wanted to go a step further:
Generating embeddings from the book highlights
Now to part 3: generating embeddings for features such as clustering and semantic search.
I have a second script, embeddings.py which takes in the downloaded google sheet and generates embeddings using sentence-transformers. The best performing model that I have found is all-MiniLM-L6-v2, a model that maps sentences and paragraphs to a 384 dimensional dense vector space.
This is the script to generate embeddings:
print("Loading libraries")

import pandas as pd
from sentence_transformers import SentenceTransformer
import json
import umap.umap_ as umap
import matplotlib.pyplot as plt
import numpy as np
import requests
import os

def get_book_title(isbn):
    api_key = os.environ.get('GOOGLE_API_KEY')
    url = f"https://www.googleapis.com/books/v1/volumes?q=isbn:{isbn}&key={api_key}"
    response = requests.get(url)

    if response.status_code != 200:
        return "Title Not Found"

    data = response.json()
    if "items" in data:
        try:
            title = data["items"][0]["volumeInfo"]["title"]
            return title
        except (IndexError, KeyError):
            return "Title Not Found"
    else:
        return "Title Not Found"

print("Loading Model")

# Load the model
model = SentenceTransformer("all-MiniLM-L6-v2")
model.max_seq_length = 256

print("Loading data")

# Read the CSV file
df = pd.read_csv('sheet.csv')

# Maintain the original 'index' column
df['original_index'] = df.index

# Group by ISBN and create indices within each group
df['group_index'] = df.groupby('isbn').cumcount()

# Extract sentences (highlights/quotes), ISBNs, and group indices
sentences = df['highlight'].tolist()
isbns = df['isbn'].tolist()
group_indices = df['group_index'].tolist()

print("Encoding data")

# Generate embeddings
embeddings = model.encode(sentences, normalize_embeddings=True)

# Convert embeddings to list for JSON compatibility and save to JSON
embeddings_list = embeddings.tolist()
data = {
    "sentences": sentences,
    "embeddings": embeddings_list,
    "isbns": isbns,
    "group_indices": group_indices
}

print("Saving embeddings")

with open("embeddings.json", "w") as file:
    json.dump(data, file)

print("Generating visualization")

# Dimensionality reduction using UMAP
umap_embeddings = umap.UMAP(n_neighbors=15, n_components=2, metric='cosine').fit_transform(embeddings)

markers = ['o', 's', '^', 'D', '*', 'x', '+', '>', '<', 'p', 'h', 'H', 'X', 'd']

# Creating a color map and fetching titles for each unique ISBN
unique_isbns = list(set(isbns))
isbn_to_title = {isbn: get_book_title(isbn) for isbn in unique_isbns}
colors = plt.cm.jet(np.linspace(0, 1, len(unique_isbns)))
isbn_to_color = {isbn: color for isbn, color in zip(unique_isbns, colors)}

plt.style.use('https://github.com/dhaitz/matplotlib-stylesheets/raw/master/pitayasmoothie-dark.mplstyle')

# Plotting
plt.figure(figsize=(12,10))
legend_elements = []

for idx, isbn in enumerate(unique_isbns):
    indices = [i for i, x in enumerate(isbns) if x == isbn]
    marker_style = markers[idx % len(markers)]  # Cycle through markers

    # Scatter plot
    scatter = plt.scatter(umap_embeddings[indices, 0], umap_embeddings[indices, 1], s=30, color=isbn_to_color[isbn], marker=marker_style)

    # Calculating centroid of each cluster
    centroid_x = np.mean(umap_embeddings[indices, 0])
    centroid_y = np.mean(umap_embeddings[indices, 1])

    # Annotate with book title at the centroid
    plt.annotate(isbn_to_title[isbn], (centroid_x, centroid_y), fontsize=9, ha='center', va='center', color='white')

    # Create a custom legend entry for each ISBN
    legend_elements.append(plt.Line2D([0], [0], marker=marker_style, color='w', label=isbn_to_title[isbn], markersize=10, markerfacecolor=scatter.get_facecolor()[0], linestyle='None'))

plt.title('Vector Space (UMAP)', fontsize=20)

# Add a legend and adjust its properties
legend = plt.legend(handles=legend_elements, title='', loc='upper right', bbox_to_anchor=(1, 0.9), bbox_transform=plt.gcf().transFigure)
legend.get_frame().set_alpha(0.5)  # Adjust the opacity

plt.grid(False)
plt.axis('off')

# Save the plot as a PNG file
plt.savefig("umap.png", dpi=300, bbox_inches='tight')
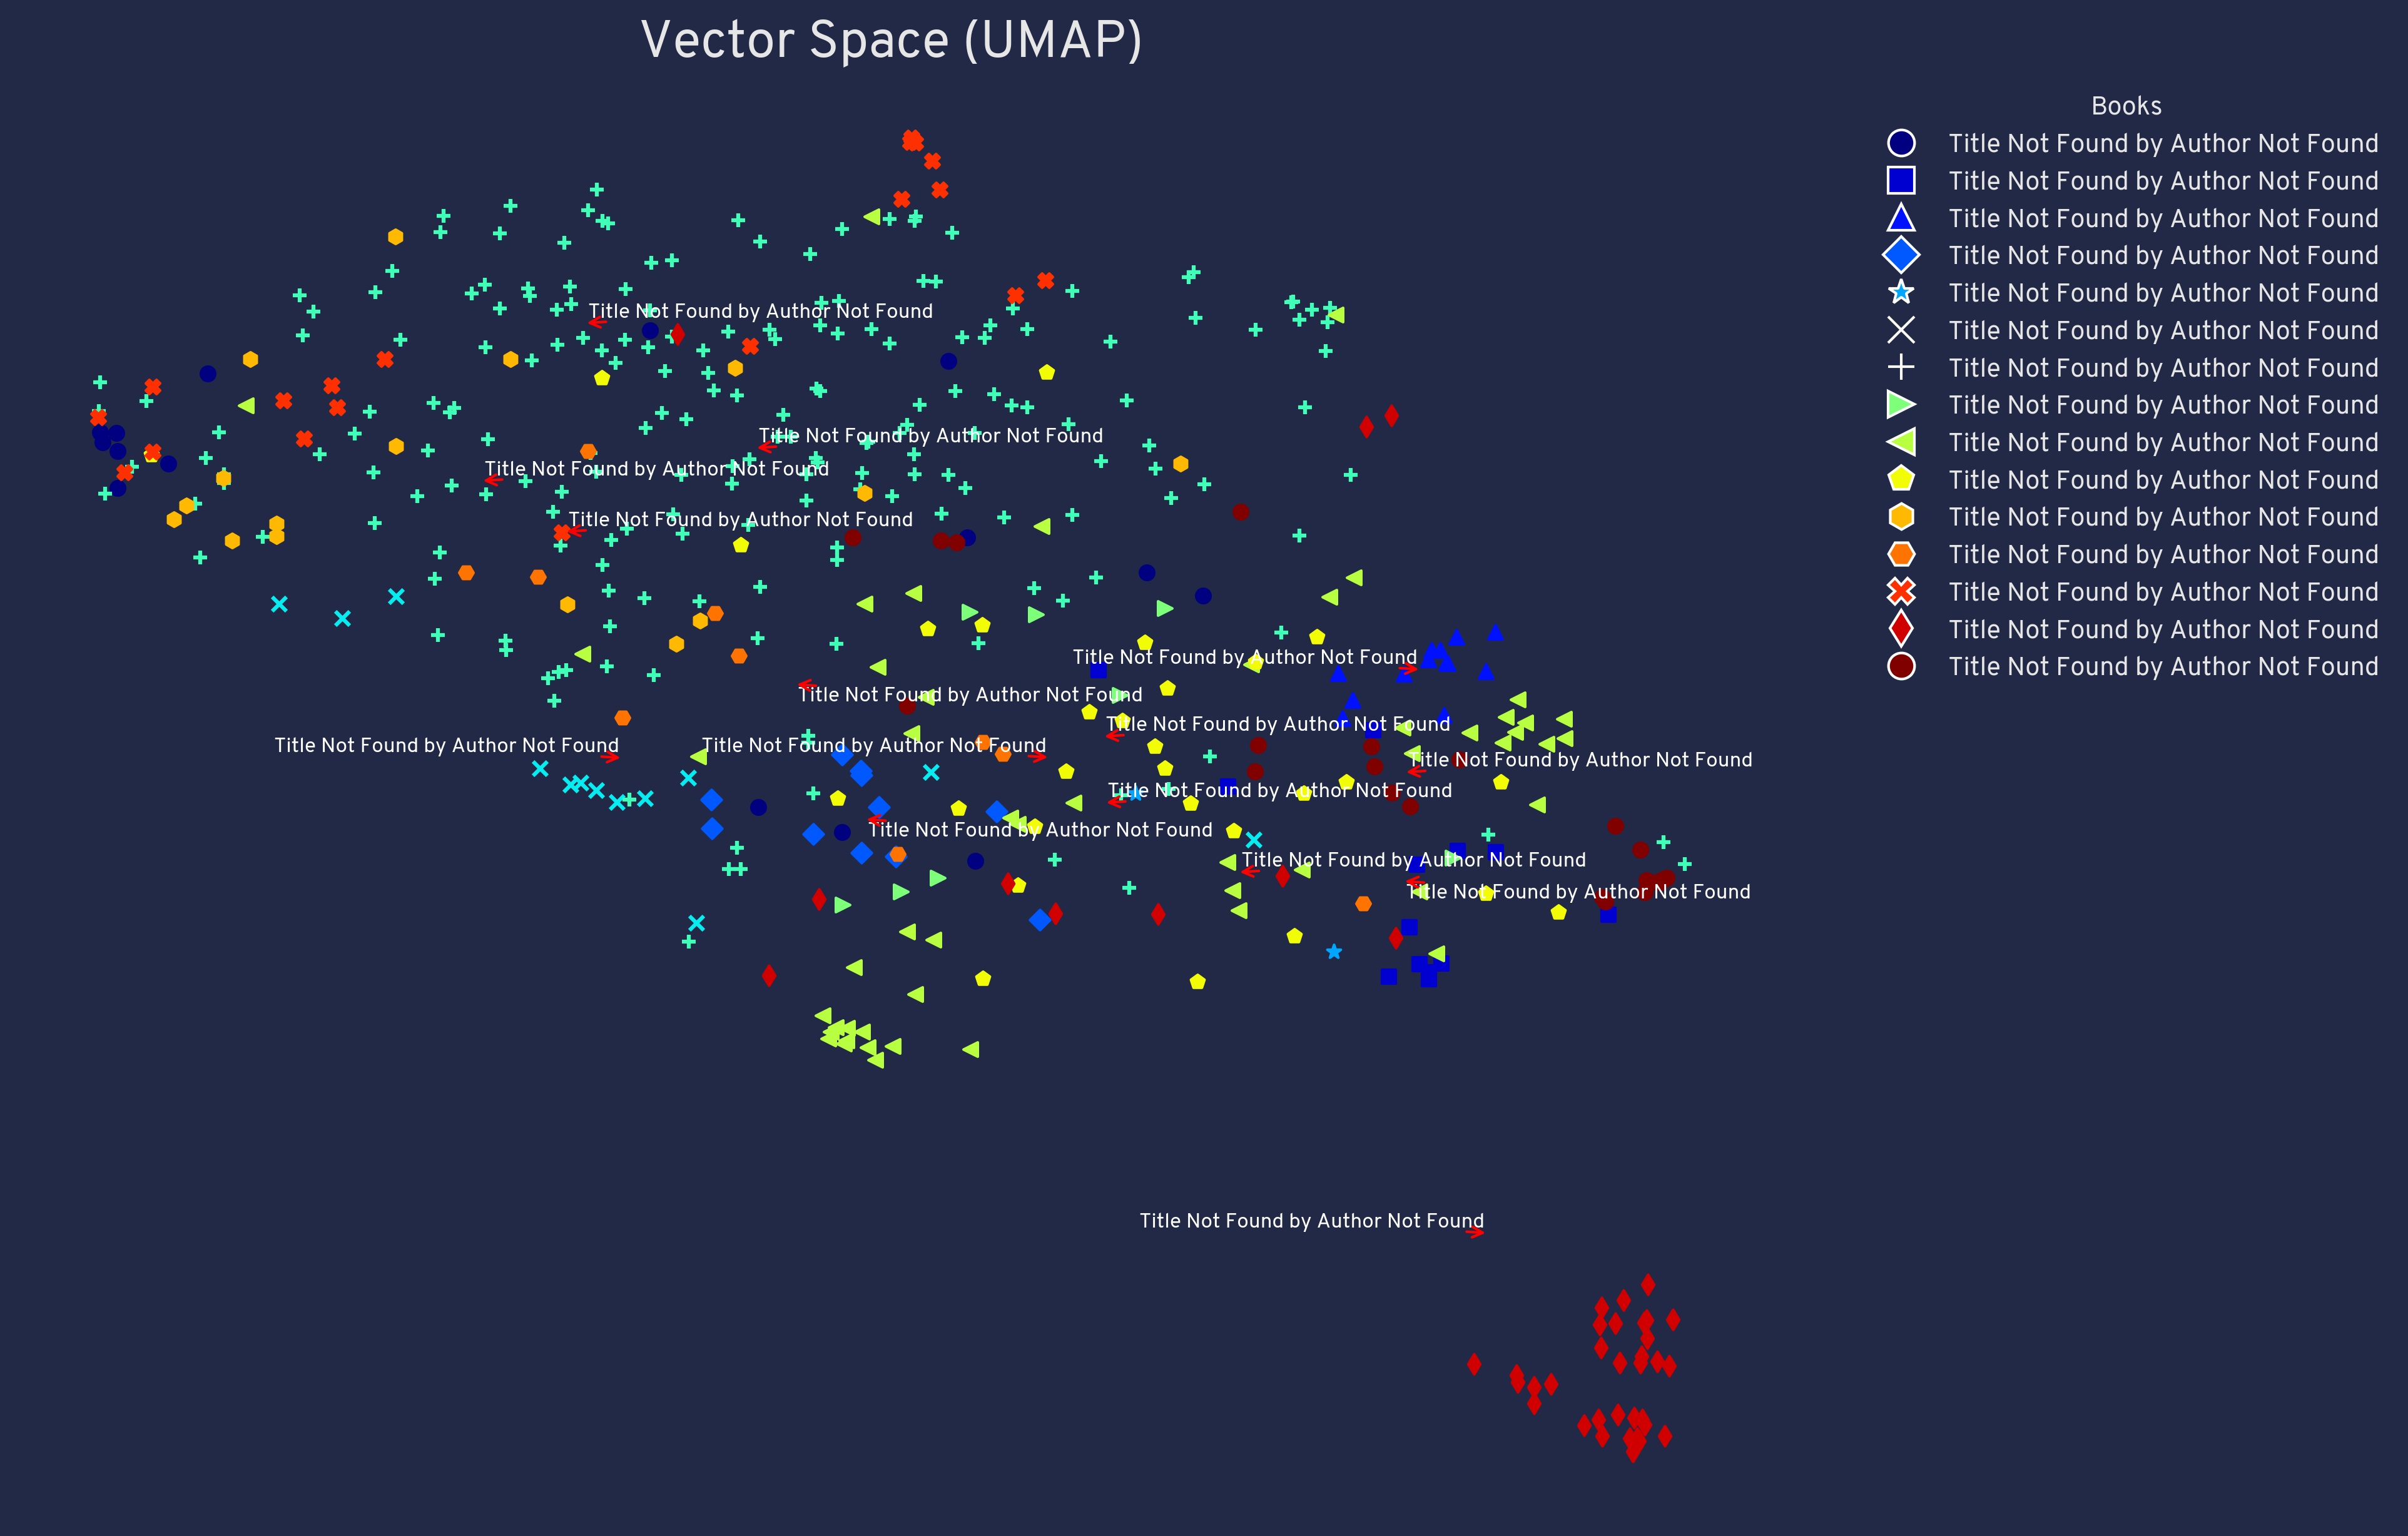
This script does two things:
- Downloads the highlights and generates embeddings from it.
- Visualizes this embeddings through UMAP.
This is enough to visualize all the highlights and cluster the books. As can be seen from the UMAP visualization, highlights from the same book cluster together and books on the same topic also cluster together, which is very interesting to see.
Semantic Search
The second part of this system is the script that takes user inputs and queries the vector space for similar highlights. This is done through the following serverless netilfy function:
const math = require('mathjs');

let pipeline;

(async () => {
  const transformers = await import('@xenova/transformers');
  pipeline = transformers.pipeline;
})();

exports.handler = async (event) => {
    // URL of the embeddings JSON file
    const embeddingsUrl = 'https://books.alessandroferrari.live/embeddings.json';

    // Fetch the embeddings data from the URL
    const response = await fetch(embeddingsUrl);
    const data = await response.json();

    const sentences = data.sentences;
    const embeddings = data.embeddings;
    const isbns = data.isbns; // Include the ISBNs
    const indexes = data.group_indices;

    console.log(isbns);
    console.log(indexes);

    // Extract query from event
    const query = event.queryStringParameters.q;

    // Initialize the feature extraction pipeline
    let extractor = await pipeline('feature-extraction', 'Xenova/all-MiniLM-L6-v2');

    // Calculate query embedding
    const queryEmbeddingOutput = await extractor(query, { pooling: 'mean', normalize: true });
    const queryEmbedding = queryEmbeddingOutput[0]; // Extract the embedding

    const arrayQueryEmbedding = Array.from(queryEmbedding.data);

    console.log(arrayQueryEmbedding);
    //console.log(embeddings.every(embedding => Array.isArray(embedding))); // Should also be true


    // Calculate similarities
    let scores = embeddings.map(embedding => {
        return math.dot(arrayQueryEmbedding, embedding) /
               (math.norm(arrayQueryEmbedding) * math.norm(embedding));
    });

    // Find top results
    let indices = scores.map((score, index) => [score, index]);
    indices.sort((a, b) => b[0] - a[0]);
    let topResults = indices.slice(0, 5);

    console.log(topResults);

    // Prepare response
    const results = topResults.map(item => {
        return {
            sentence: sentences[item[1]],
            similarity: item[0],  // Add the similarity score
            isbn: isbns[item[1]], // Include the ISBN
            index: indexes[item[1]]
        };
    });

    return {
        statusCode: 200,
        body: JSON.stringify(results)
    };

};
It’s important to use the same embedding model, otherwise the query will be mapped differently and won’t be of much use.
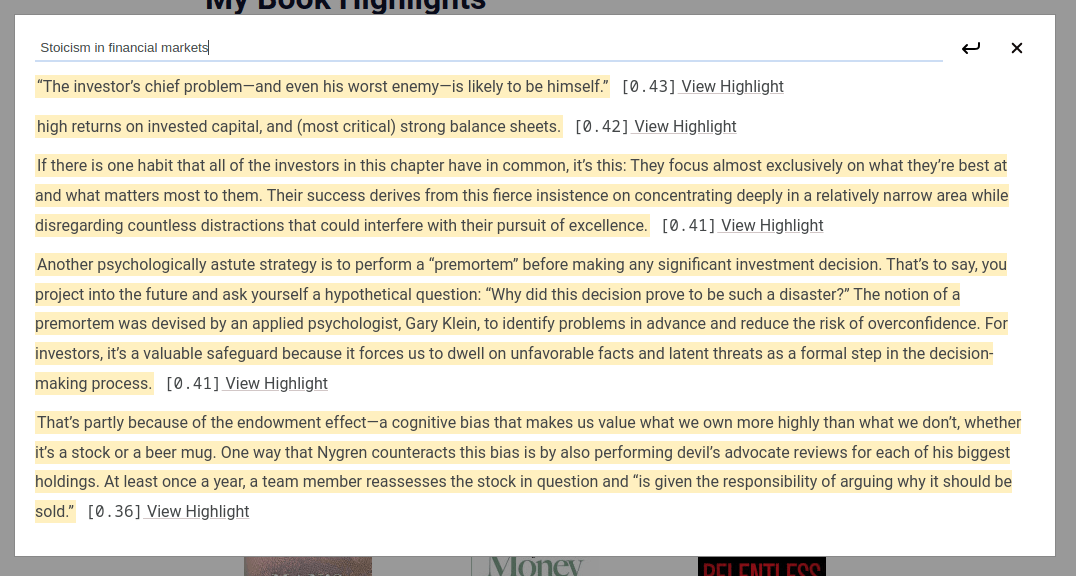
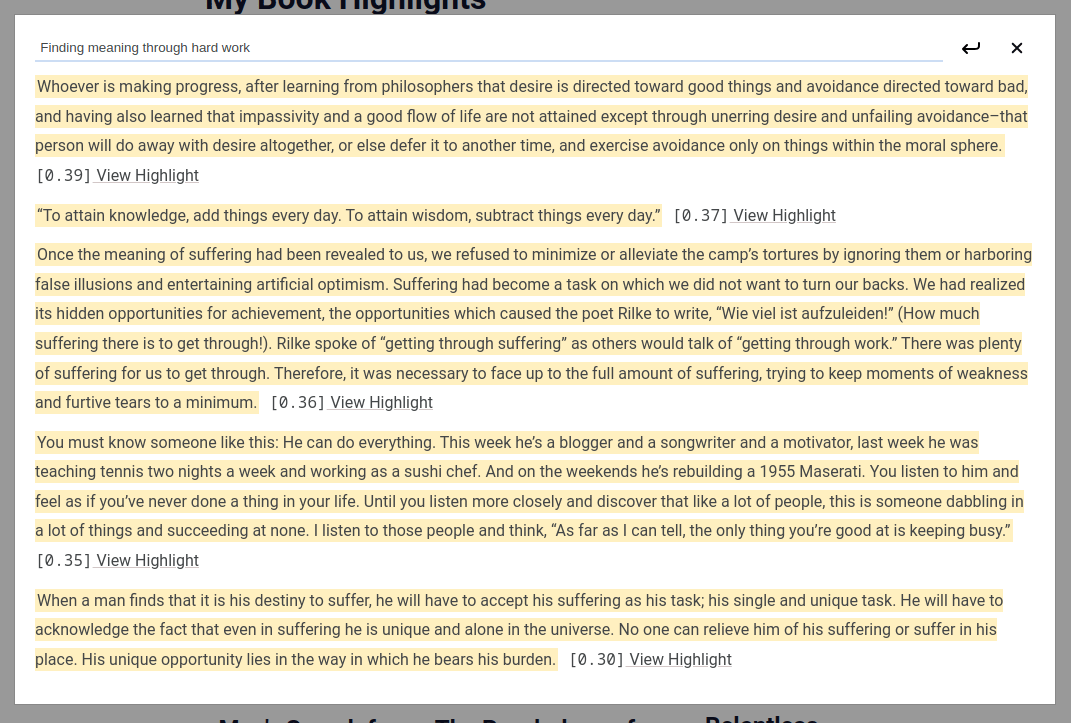
Through this function I implemented semantic search, meaning that I can search for things such as “Stoicism in financial markets” or “Finding meaning through hard work” and these will be the responses:
Interactively visualizing vector embeddings
I however wanted to go a step further: I wanted to see a live representation of my highlights, so I wrote a simple python script that lets me see the vector space of the highlights in an interactive manner. Here is live-embeddings.py:
import json
import plotly.graph_objects as go
import plotly.express as px
import pandas as pd
import umap.umap_ as umap
import numpy as np
import os
import requests
import textwrap

# Function to fetch book titles using Google Books API
def get_book_title(isbn):
    api_key = os.environ.get('GOOGLE_API_KEY')
    url = f"https://www.googleapis.com/books/v1/volumes?q=isbn:{isbn}&key={api_key}"
    response = requests.get(url)

    if response.status_code != 200:
        return "Title Not Found"

    data = response.json()
    if "items" in data:
        try:
            title = data["items"][0]["volumeInfo"]["title"]
            return title
        except (IndexError, KeyError):
            return "Title Not Found"
    else:
        return "Title Not Found"

# Load data from embeddings.json
with open("embeddings.json", "r") as file:
    data = json.load(file)

embeddings = np.array(data["embeddings"])
sentences = data["sentences"]
isbns = data["isbns"]

# Dimensionality reduction using UMAP
umap_embeddings = umap.UMAP(n_neighbors=15, n_components=2, metric='cosine').fit_transform(embeddings)

# Get unique ISBNs and their corresponding titles
unique_isbns = list(set(isbns))
isbn_to_title = {isbn: get_book_title(isbn) for isbn in unique_isbns}
colors = px.colors.qualitative.Plotly

highlight_ids = {isbn: 0 for isbn in unique_isbns}

# Function to generate URL and update highlight IDs
def generate_url(isbn):
    url = f"https://books.alessandroferrari.live/{isbn}#{highlight_ids[isbn]}"
    highlight_ids[isbn] += 1
    return url

# Generate URLs for each highlight
urls = [generate_url(isbn) for isbn in isbns]

# Wrap text for each highlight and append URL
wrapped_sentences_with_url = [
    '<br>'.join(textwrap.wrap(sentence, width=80)) + f"<br>URL: {url}"
    for sentence, url in zip(sentences, urls)
]

# Prepare Plotly data
plot_data = pd.DataFrame({
    'x': umap_embeddings[:, 0],
    'y': umap_embeddings[:, 1],
    'text': wrapped_sentences_with_url,
    'isbn': isbns
})

# Create Plotly figure
fig = go.Figure()

for idx, isbn in enumerate(unique_isbns):
    isbn_data = plot_data[plot_data['isbn'] == isbn]
    fig.add_trace(go.Scatter(
        x=isbn_data['x'],
        y=isbn_data['y'],
        mode='markers',
        marker=dict(color=colors[idx % len(colors)], size=10),
        text=isbn_data['text'],  # Include the wrapped text with URL
        hoverinfo='text',       # Only show the text on hover
        name=isbn_to_title[isbn]
    ))

# Update layout
fig.update_layout(
    title='',
    plot_bgcolor='white',
    xaxis=dict(showgrid=False, zeroline=False, showticklabels=False),
    yaxis=dict(showgrid=False, zeroline=False, showticklabels=False)
)

# Save the figure as an HTML file
fig.write_html("plotly-out.html")
This simple script generates an html file that can be seen here. From this I can see all my highlights by hovering my mouse over the dots.
As a cherry on top, a netlify build can be triggered every time the google sheet gets updated through a simple Google AppScript and AppScript trigger:
function triggerNetlifyBuild() {
var scriptProperties = PropertiesService.getScriptProperties();
var lastDeployTime = scriptProperties.getProperty('lastDeployTime');
var currentTime = new Date().getTime();

// Check if last deploy was less than 5 minutes ago
if (lastDeployTime !== null && (currentTime - lastDeployTime) < 5 * 60 * 1000) {
	Logger.log('Deploy skipped to prevent spamming. Less than 5 minutes since last deploy.');
	return;
}

scriptProperties.setProperty('lastDeployTime', currentTime.toString());

// Your Netlify hook URL
var netlifyHookUrl = scriptProperties.getProperty('NETLIFY_BUILD_ID')

UrlFetchApp.fetch(netlifyHookUrl, { method: 'POST' });
Logger.log('Netlify build triggered.');
}
This script sends a post request to a netlify build hook, and can be triggered every time the script gets edited. I also added a countdown to avoid spam.
Email quotes to your inbox
Since this whole system is very expandable and modular, I implemented another cool feature that I saw in products such as Readwise: getting your own quotes in your inbox for recollection and resurfacing old concepts. I implemented this using Google AppScript, making it again free and serverless.
I have a trigger that runs every day between 6am and 7am which picks 3 random quotes from the sheet and formats them nicely in my inbox. Here are the functions:
function getBookInfoByISBN(isbn) {
	var scriptProperties = PropertiesService.getScriptProperties();
	var API_KEY = scriptProperties.getProperty('BOOK_API');
	var url = 'https://www.googleapis.com/books/v1/volumes?q=isbn:' + isbn + '&key=' + API_KEY + '&country=US';
	var response = UrlFetchApp.fetch(url);
	var json = JSON.parse(response.getContentText());

	if (json.totalItems > 0) {
		var book = json.items[0].volumeInfo;
		return { title: book.title, author: book.authors ? book.authors.join(", ") : "Unknown Author" };
	} else {
		return { title: 'Unknown Title', author: 'Unknown Author' };
	}
}
function sendRandomQuotesEmail() {
	var sheet = SpreadsheetApp.getActiveSpreadsheet().getActiveSheet();
	var data = sheet.getDataRange().getValues();
	var randomQuotes = getRandomQuotes(data, 3);

	var message = '<div style="font-family: Arial, sans-serif; font-size: 14px;">';

	randomQuotes.forEach(function(quote) {
		// Each quote with highlighted background and citation in standard text
		message += `<p style="word-wrap: break-word;">` +
		`<span style="background-color: rgba(255, 226, 130, 0.5);">${quote.text}</span>` +
		`</p>` +
		`<p style="font-style: italic; margin-top: 5px;">—${quote.title} by ${quote.author}</p>`;
	});

	// End of the message
	message += '</div>';

	MailApp.sendEmail({
		to: "<your email>",
		subject: "Your Daily Book Quotes",
		htmlBody: message
	});
}
function getRandomQuotes(data, numberOfQuotes) {
	var quotes = [];
	var usedIndices = [];

	while (quotes.length < numberOfQuotes) {
		var randomIndex = Math.floor(Math.random() * data.length);
		if (usedIndices.indexOf(randomIndex) === -1) {
			usedIndices.push(randomIndex);
			var isbn = data[randomIndex][1];
			var bookInfo = getBookInfoByISBN(isbn);
			var quoteText = data[randomIndex][0];

			quotes.push({
				text: quoteText,
				title: bookInfo.title,
				author: bookInfo.author
			});
		}
	}
	return quotes;
}
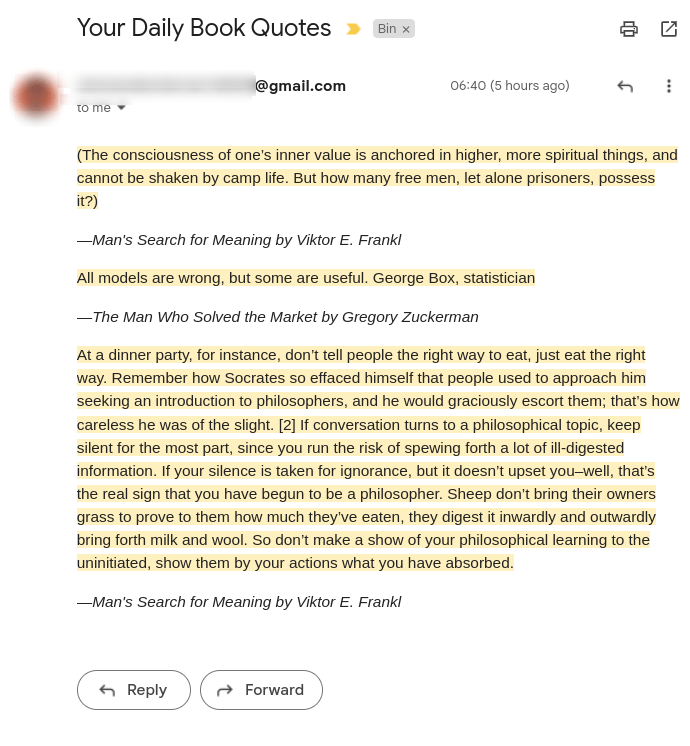
This way I get a daily email with 3 highlights that looks like this:
Summary
Wrapping up, this project is a cost-effective solution for transforming book highlights into an interactive, searchable vector space on my website. The system, entirely serverless and automated, updates in real-time with each addition to a Google Sheet. It also leaves space for plugins and extensions, such as the three daily highlights that land in my inbox.
The core of this project lies in how these highlights are not just static text but dynamic data points in a vector space, enabling semantic search. This integration of technology with literature not only highthens the reading experience but also demonstrates the practical application of machine learning in personal projects.
Although this project is public on the internet, I will probably be the one benefitting from it the most, as I like looking back at my own highlights.
The project is currently live at books.alessandroferrari.live. And the source code for it can be found on github.